Case

Application

FAQ
What is a Smart Meter?
FAQ|What is a Smart Meter?A smart meter is an advanced electricity metering device that offers more functionality compared to traditional meters. It is commonly referred to as an intelligent power meter or a smart energy meter.
Smart Meter
A smart meter is a new-generation digital electricity meter that accurately records power consumption and transmits the data via a network. It is considered a fundamental part of the smart grid infrastructure.
Source: Wikipedia
Compared to traditional electricity meters, smart meters offer enhanced features and functionalities. They measure electricity consumption and use data communication technology to transmit this information to power companies or other relevant management units.
Key Features of Smart Meters:
Data Collection and Transmission: Smart meters collect electricity consumption data from users and transmit it wirelessly or via wired communication to power companies or other management units.
Remote Meter Reading: Unlike traditional meters that require manual readings, smart meters enable remote data collection, reducing labor costs and time.
Consumption Analysis: Equipped with user interfaces or management platforms, smart meters provide electricity consumption reports, allowing users to monitor their usage and implement energy-saving measures.
Types of Smart Meters
Taipower's AMI Smart Meter Service
Most residential and commercial users currently use traditional electricity meters, which require Taipower personnel to conduct manual readings. However, manual meter reading can lead to human errors, sometimes resulting in billing mistakes that make the news.
With the growing adoption of digital data technologies and the government's active promotion of smart grid planning, Taipower has deployed 2,802,650 smart meters (as of January 31, 2024). This has significantly reduced the need for manual meter reading.
AMI (Advanced Metering Infrastructure) allows users to record electricity usage and send periodic data reports. Users can also download the Taipower app to check their electricity consumption records anytime.
Traditionally, users only notice electricity price increases when they receive their bills. However, with smart meters, they can track their electricity consumption every six hours and adjust their habits accordingly to select the most suitable rate plan.
# Taipower AMI
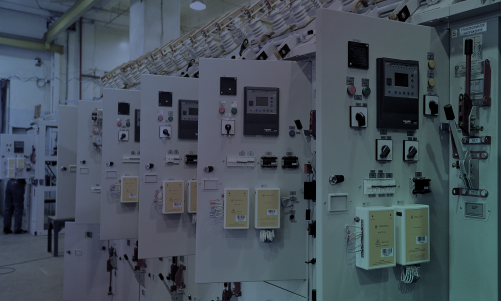
Communication-Based Industrial Smart Meters
For large power consumers, industrial electricity users, and self-generated electricity management, high-energy-consuming factories, on-site substations, and continuous production lines can benefit from additional monitoring beyond Taipower’s smart meters.
In addition to using Taipower’s smart meters, businesses can install industrial smart meters to monitor specific equipment or production lines requiring precise power consumption management. These meters provide detailed parameters such as single-phase and three-phase voltage, current, active and reactive power, power factor, demand, frequency, and carbon emissions, making them ideal for maximizing energy efficiency in factory operations.
# Industrial Smart Meter
Understanding Smart Meter Functions in Simple Terms
What Do the Parameters on an Industrial Smart Meter Represent?
Voltage: Unit V (Volts)
1. Voltage imbalance can damage equipment and may lead to increased reactive power consumption.
2. Equipment failure may cause voltage drops, potentially triggering automatic power shutdowns.
3. Monitoring voltage fluctuations can help detect load variations, allowing users to adjust generator output or distribute loads for stable operation.
4. A three-phase voltage imbalance should not exceed 4.5% as a general rule.
5. Voltage (V) = Watt (W) ÷ Current (A)
6. Standard voltage levels are typically 110V or 220V.
7. Ideal three-phase voltage means equal amplitude across all phases, with a phase difference of 120 degrees between any two phases. Any deviation from these conditions results in three-phase voltage imbalance.
Current: Unit A (Amperes)
1. When load increases, current usually rises. Understanding current variations can help users adjust generator output.
2. Excessive current (overcurrent) beyond the equipment's rated capacity can lead to overheating, damage, or shutdown.
3. Current imbalance can cause system instability and equipment failure.
4. Current (A) = Watt (W) ÷ Voltage (V)
Active Power: Unit W (Watts) (Also Known as Real Power or Average Power)
1. Used to evaluate equipment energy efficiency (how much electrical energy is converted into actual work).
2. Watt (W) = Voltage (V) × Current (A)
3. The average value of instantaneous power over a full cycle.
4. The actual power consumed by resistance within an electrical circuit.
Example: An oven with a power consumption of 3000W at 110V results in a current of 3000W ÷ 110V = 27.3A. At 220V, the current would be 13.6A.
Higher voltage leads to lower current, improving efficiency. Therefore, 220V is more energy-efficient.
Reactive Power: Unit Var (AC Power Symbol: Q) (Also Known as Demand Power or Inductive Power)
1. Power that does not result in actual energy consumption.
2. Excessive reactive power can cause voltage drops, while too little can lead to voltage surges, requiring it to be maintained within a reasonable range.
3. Used for energy exchange between electric fields and magnetic fields within a circuit and to establish and maintain magnetic fields in electrical devices.
4. Installing capacitors or reactors can help reduce reactive power flow, improve power factor, and enhance equipment efficiency.
5. Reducing reactive power can lower electricity costs.
Apparent Power: Unit VA (AC Power Symbol: S)
1. Apparent power is the sum of active power and reactive power.
2. Used to indicate the capacity of AC equipment and to calculate the required current for an AC load.
3. Represents the total power supplied by a power source in an AC circuit.
4. Useful for assessing the total power in an electrical system.
5. Helps evaluate voltage quality; significant power fluctuations may cause voltage instability.
6. Assists users in assessing circuit and equipment capacity; if apparent power demand exceeds equipment capacity, upgrades or additional equipment may be required.
Power Factor (PF)
1. The value ranges between -1 and 1.
2. A power factor closer to 1 indicates higher efficiency of the equipment.
3. Changes in power factor can also indicate the quality of the electrical supply.
4. A low power factor results in higher line losses, necessitating the installation of capacitors or similar equipment to improve reactive power efficiency, which may require additional investment.
5. Electricity billing often includes power factor regulations, and users with low power factors may incur higher electricity charges.
Frequency: Unit Hz
1. When the frequency remains close to the standard value (50Hz or 60Hz), it indicates stable operation of equipment.
2. Users can regulate frequency through generator control to ensure stable equipment operation.
Active Energy: Unit kWh
1. Represents the actual energy used to perform work.
2. A key factor in electricity cost management.
Reactive Energy: Unit kVarh
1. Reactive energy is related to reactive power and can be reduced by improving the power factor.
2. Excessive reactive energy indicates low energy efficiency and waste.
Apparent Energy: Unit kVAh
Apparent power accumulated over time.
Total Harmonic Distortion of Voltage (THD): Unit %
1. Evaluates voltage quality and stability; lower values indicate a purer voltage waveform.
2. Precision instruments require a cleaner voltage waveform; excessive harmonic distortion can degrade performance.
Total Harmonic Distortion of Current (THD): Unit %
1. High harmonic distortion in current increases energy costs.
2. High harmonic distortion can reduce equipment efficiency, cause overheating, and shorten lifespan.
Phase Angle: Unit °
1. A phase angle close to 0° indicates a balanced distribution between active and reactive power.
2. Phase angle is used to assess the consistency of voltage and current waveforms.
3. The difference in phase between two AC signals of the same frequency is called phase difference or phase shift.
Three-Phase Imbalance: Unit %
1. Used to assess voltage quality and stability.
2. Imbalance can lead to increased energy costs.
3. A sudden change in imbalance indicates potential equipment failure.
4. Normal operating range is approximately 2%, with a short-term limit of 4%.
Demand: Unit MW / kW
Using the demand curve, peak load times and magnitudes can be identified, helping users plan power grid capacity, upgrade substations, or enhance transmission lines.
Maximum Demand Record: Unit MW / kW
1. Understanding maximum demand and peak time allows users to predict future load peaks, aiding in equipment capacity planning and power supply strategies.
2. Reducing power consumption during peak demand periods can lower electricity costs.
3. Monitoring maximum demand helps maintain power stability and efficient energy allocation.
4. For large industrial power consumers, it supports power trading and optimized energy procurement strategies.
Carbon Emissions: CO2e
1. High carbon emissions indicate energy waste, increased costs, low efficiency, and negative environmental impact.
2. Carbon emission data can be a factor for investors in evaluating continued investments.
3. The total amount of greenhouse gases emitted from a source is calculated by multiplying each substance by its global warming potential and expressed in metric tons of CO2 equivalent, rounded to the third decimal place.
Looking for a Smart Energy Management System?
Energy management is a crucial field closely related to environmental issues. In business operations, especially in the manufacturing industry, energy is a significant cost factor and also has a major impact on the environment. Therefore, managing energy to save electricity costs not only enhances economic benefits for businesses but also reduces environmental impact, aligns with ESG principles, and is closely related to the objectives of EMS (Energy Management System).
The EMS Smart Energy Management System collects data through smart meters and converts it into visualized charts for users. This includes energy usage trends, electricity cost comparisons, and equipment efficiency evaluations. The dashboard displays the most critical and easy-to-read data for users. It also provides real-time data monitoring, instant alerts, automatic data collection, and automatic generation of statistical reports, reducing labor costs associated with manual monitoring and analysis while improving data usability and offering more accurate optimization recommendations.
Can Energy Saving and Carbon Reduction Be Managed Simultaneously?
EMS Smart Energy Management System
Companies are increasingly required to achieve carbon neutrality or emission reduction targets. Effective energy management is a crucial part of achieving sustainable production goals, supporting global sustainability efforts.
Source: Online News, Taiwan Hydrogen Energy & Fuel Cell Partnership, Technology Media, Wikipedia